
 Log in
 Start Free Trial

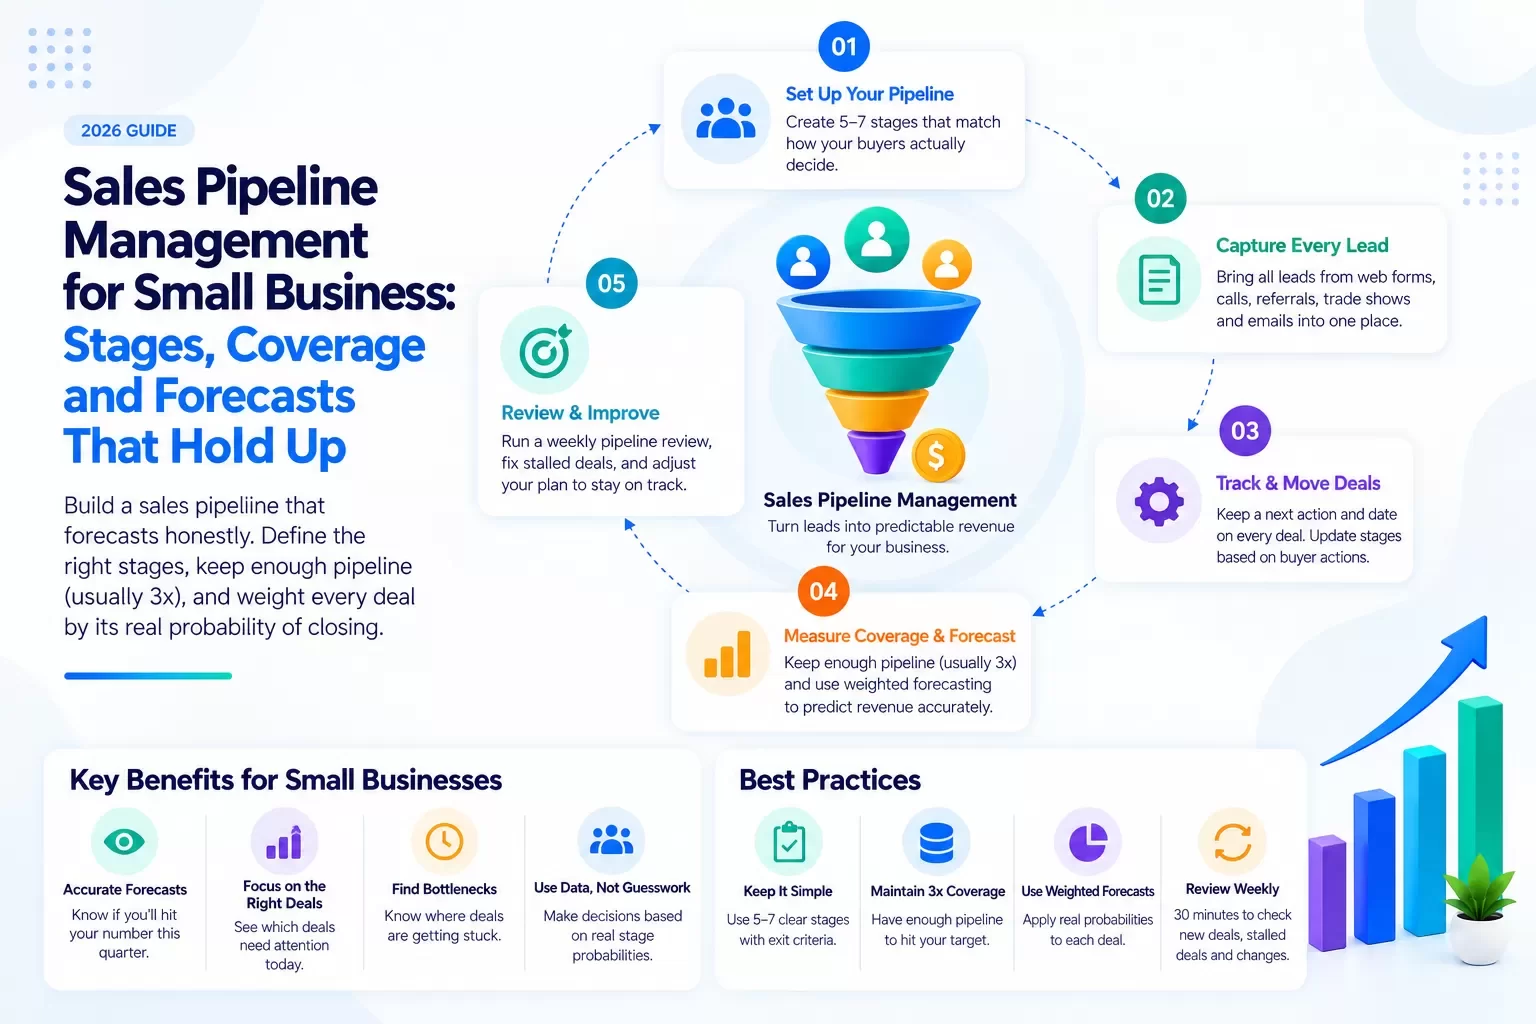
What is sales pipeline management, really?
A pipeline is not a list of deals. It is a model of your future revenue.
Every open opportunity sits in a stage. Every stage carries a probability. Every deal has a next action and a date. Pipeline management is the discipline of keeping that model honest, week after week, so you can answer three questions any owner or sales leader should answer in under a minute:
- Will we hit the number this quarter?
- Which deals need attention today?
- Where are deals getting stuck?
Most small teams cannot answer these, not because they lack effort but because their pipeline lives in five places: a spreadsheet, an inbox, a notebook, a texting thread and someone's memory. No fragmented tools. That is the first rule.
What are the standard sales pipeline stages?
Start simple. Most small businesses need five to seven stages. More than that and reps stop updating them.
| Stage | Exit criteria (what must be true to move forward) | Typical probability |
|---|---|---|
| 1. New lead | Contact captured, source recorded | 5% |
| 2. Qualified | Need, budget range, timeline and decision-maker confirmed | 15% |
| 3. Discovery / site visit | Requirements documented, meeting notes logged | 30% |
| 4. Proposal sent | Priced proposal delivered with a follow-up date | 50% |
| 5. Negotiation | Buyer engaged on terms, scope or price | 70% |
| 6. Closed won / lost | Signed agreement, or lost reason recorded | 100% / 0% |
Two rules make stages work:
- Define stages by buyer actions, not seller activity. "Proposal sent" is only real when the buyer has agreed to review it on a specific date.
- Calibrate probabilities from your own history. The percentages above are starting points. After two quarters, replace them with your actual stage-to-close rates.
How do you build a sales pipeline from scratch?
Here is the sequence we use when Hexagon IT Solutions implements a CRM for a small team.
- Pick one revenue motion. New-customer sales, not renewals and upsells mixed together. Separate pipelines for separate motions.
- Write the exit criteria for each stage in one sentence. If two reps would disagree about a deal's stage, the criteria are too vague.
- Capture every lead in one place. Web forms, calls, referrals, trade shows, emails. If it does not land in the pipeline, it does not exist.
- Require a next action and date on every open deal. A deal without a next step is a deal that is quietly dying.
- Set your coverage target (math below).
- Review weekly, 30 minutes, same agenda: new deals, stalled deals, deals slipping past close date, forecast change.
What is a pipeline coverage ratio, and how do you calculate it?
Pipeline coverage tells you whether you have enough open opportunity to hit your target.
Formula:
Pipeline coverage ratio = Total open pipeline value for the period / Revenue target (or remaining gap) for the period
Most B2B teams aim for roughly 3x. The right number for you is the inverse of your win rate: if you win 1 in 4 qualified deals, you need about 4x coverage.
Worked example (hypothetical): A 6-person roofing and exteriors company has a Q4 revenue target of $900,000. They have already closed $150,000, so the remaining gap is $750,000.
- Open pipeline closing in Q4: $1,650,000
- Coverage = $1,650,000 / $750,000 = 2.2x
- Their trailing win rate on qualified bids is 30%, so required coverage is 1 / 0.30 = 3.3x
- Required pipeline = $750,000 x 3.3 = $2,475,000
- Shortfall: $825,000 in new qualified pipeline, or roughly 16 more commercial bids at their $50,000 average
That one calculation changes the Monday meeting. Instead of "are we on track?" the question becomes "where do 16 more qualified bids come from in the next three weeks?"
How do you build a weighted forecast?
Coverage tells you if you have enough. A weighted forecast tells you what you will likely close.
Weighted value = Deal value x Stage probability
Example: the same roofing company's top Q4 deals (hypothetical)
| Deal | Stage | Value | Probability | Weighted value |
|---|---|---|---|---|
| Retail center re-roof | Negotiation | $220,000 | 70% | $154,000 |
| HOA community (42 homes) | Proposal sent | $310,000 | 50% | $155,000 |
| Medical office TPO | Proposal sent | $95,000 | 50% | $47,500 |
| School district gutters | Discovery / site visit | $140,000 | 30% | $42,000 |
| Warehouse coating | Qualified | $180,000 | 15% | $27,000 |
| Church re-roof | Negotiation | $65,000 | 70% | $45,500 |
| Total | $1,010,000 | $471,000 |
Unweighted, this looks like a million-dollar quarter. Weighted, it is $471,000 against a $750,000 gap. That is the conversation you want in October, not December.
Two refinements that sharpen the forecast:
- Age penalty: if a deal has sat in one stage for more than twice your average stage duration, halve its probability.
- Commit category: ask each rep to mark deals "commit," "best case" or "pipeline." Compare their commit list to the weighted number each week.
Vertical pipeline templates you can copy
Generic stages miss the moments that matter in your industry. Here are three templates we use as starting points.
Construction bid pipeline (general and specialty contractors)
| Stage | Exit criteria | Starting probability |
|---|---|---|
| Invitation to bid / lead | Plans or scope received, bid due date logged | 5% |
| Go / no-go | Fit, capacity, margin and relationship reviewed | 10% |
| Site walk / takeoff | Site visit notes and quantities captured | 20% |
| Bid submitted | Priced bid delivered, follow-up date set | 30% |
| Short-listed / scope review | GC or owner requests clarifications or value engineering | 55% |
| Award / contract | Notice of award or signed contract | 90% |
| Won / lost | Contract executed, or lost reason and winning price recorded | 100% / 0% |
Tip: record the winning bid price on every loss. After 20 losses you will know whether you lose on price, scope or relationships.
Property management and real estate (owner-lead pipeline)
| Stage | Exit criteria | Starting probability |
|---|---|---|
| Owner inquiry | Property address, unit count, current management status | 5% |
| Discovery call | Pain points, goals, current fee and contract end date | 20% |
| Property walk / rental analysis | Rent comps and condition notes delivered | 35% |
| Management proposal | Fee structure and onboarding plan sent | 55% |
| Agreement review | Owner reviewing management agreement | 75% |
| Signed / lost | Signed agreement, or lost reason recorded | 100% / 0% |
Owner leads often go quiet for months while a current contract runs out. Log the contract end date and set a follow-up 60 days before it.
Field-service jobs (HVAC, plumbing, electrical, solar)
| Stage | Exit criteria | Starting probability |
|---|---|---|
| Service request / lead | Contact, address, issue logged | 10% |
| Scheduled assessment | Tech or estimator booked | 30% |
| On-site estimate | Photos, measurements and options presented | 50% |
| Quote sent (good / better / best) | Written quote with financing options | 55% |
| Follow-up | Buyer questions answered, decision date set | 65% |
| Sold / lost | Job booked, or lost reason recorded | 100% / 0% |
Field-service cycles are short. Measure stage age in days, not weeks.
Where AI actually helps a small-business pipeline
AI should not add work. It should remove the updating that reps hate and surface the decision that matters.
Here is the moment that counts. A roofing estimator finishes a site walk and records a two-minute voice note in the truck. Arches CRM transcribes it, logs the notes to the deal, moves it to "Site walk / takeoff" and suggests the next action: "Send bid by Thursday; owner mentioned a competing quote due Friday" [CONFIRM: AI voice-note transcription, auto stage update and next-action suggestion live].
| Step | What the rep does | What Arches does |
|---|---|---|
| 1 | Records meeting or site notes | Captures and summarizes the conversation [CONFIRM: AI meeting summaries live] |
| 2 | Nothing | Scores the deal on engagement, stage age and fit [CONFIRM: AI deal scoring live] |
| 3 | Reviews the suggested next action | Recommends the next action and due date [CONFIRM: AI next-action suggestions live] |
| 4 | Approves the proposal draft | Drafts the proposal from meeting notes [CONFIRM: AI proposal drafting live] |
| 5 | Nothing | Sends the scheduled follow-up automatically [CONFIRM: automated follow-up sequences live] |
That is the promise behind Sales Made Simple: stop managing your CRM, start closing deals.
The weekly pipeline review: a 30-minute agenda
- Coverage check (5 min): remaining gap vs. open pipeline vs. required ratio.
- Weighted forecast change (5 min): what moved up, what moved down, why.
- Stalled deals (10 min): every deal past 2x average stage age gets a decision: advance, re-date or close lost.
- Missing next actions (5 min): zero tolerance. Every open deal has a dated next step.
- Wins and losses (5 min): one lesson from each.
Run this every week for a quarter and your forecast accuracy will improve because the data improves.
Common pipeline mistakes small businesses make
- Too many stages. If a stage never changes a decision, merge it.
- Keeping dead deals open. Inflated pipeline hides a coverage problem until it is too late.
- No lost reasons. Losses are your cheapest market research.
- Mixing motions. New sales, renewals and service upsells need separate pipelines.
- Updating after the fact. The best pipeline data is captured in the moment, from the phone, at the job site.
FAQ
What is the best way to manage a sales pipeline for a small business?
Use five to seven buyer-defined stages, require a next action on every deal, keep about 3x coverage (or 1 divided by your win rate), and review weekly in a fixed 30-minute meeting.
How many sales pipeline stages should a small business have?
Five to seven. Fewer and you lose visibility; more and reps stop updating. Each stage needs one-sentence exit criteria.
What is a good pipeline coverage ratio?
Around 3x is a common benchmark, but calculate yours as 1 divided by your win rate. A 25% win rate needs roughly 4x coverage.
How is a weighted pipeline forecast calculated?
Multiply each deal's value by its stage probability, then add them up. Calibrate probabilities with your own historical stage-to-close rates.
Can a spreadsheet work as a sales pipeline?
For a solo seller with a handful of deals, briefly. Once you have multiple reps, field visits or more than 30 open deals, a spreadsheet cannot capture conversations, next actions or automated follow-up.
How does AI improve pipeline management?
It removes manual updates and highlights risk: summarizing meetings, scoring deals and suggesting next actions. In Arches CRM these run inside the pipeline [CONFIRM: AI deal scoring and next-action features live].
Internal link suggestions
- Best CRM With Email Marketing for Small Business: 2026 Comparison
- Mobile CRM App for Small Business: A Field-First Buying Guide
- Post-Sale Relationship Management: The Follow-Up Playbook for Contractors and Service Pros
- Link "coverage ratio" to the Arches campaign ROI calculator [CONFIRM: calculator live + URL]
LinkedIn teaser
Your pipeline says $1M. Your weighted forecast says $471K. Here is the coverage math every small-business owner should run before Q4 closes.
Start closing deals
Small team? Start your free trial of Arches CRM and set up your first pipeline in an afternoon.
Sales team of 100+? Book a demo and we will map your stages, coverage targets and forecast model with you.